IBM Envizi ESG Suite Streamlining Sustainability
IBM Envizi ESG Suite is a powerful platform designed to help organizations manage and report on their environmental, social, and governance (ESG) performance. It simplifies complex data collection, analysis, and reporting processes, enabling businesses to track their progress toward sustainability goals, benchmark against competitors, and enhance their ESG disclosures. The suite offers a comprehensive set of tools and features, making ESG management more efficient and insightful.
This platform handles data from various sources, validating its accuracy and allowing for seamless integration. From creating compelling reports aligned with leading frameworks like GRI and SASB to tracking key performance indicators (KPIs) and conducting insightful benchmarking analyses, IBM Envizi ESG Suite provides a holistic approach to ESG management. It’s designed for a wide range of users, from sustainability professionals to executive leadership, providing the data and insights needed to make informed decisions and drive positive change.
IBM Envizi ESG Suite Overview
Source: g2crowd.com
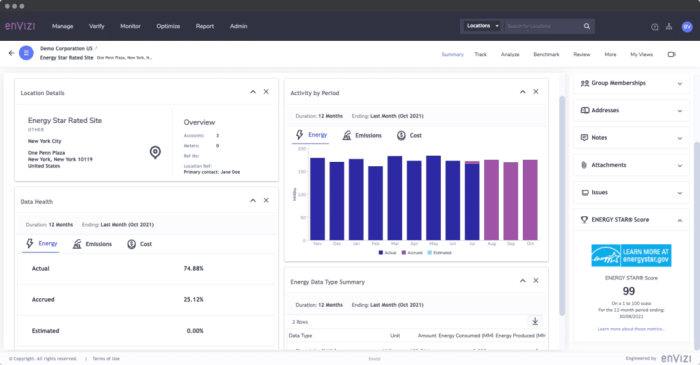
IBM Envizi ESG Suite is a comprehensive software solution designed to help organizations manage and report on their environmental, social, and governance (ESG) performance. It provides a centralized platform for collecting, analyzing, and reporting ESG data, enabling businesses to track their progress toward sustainability goals and meet regulatory requirements.
The suite’s core functionalities revolve around data collection, analysis, and reporting. It allows users to gather ESG data from various sources, including internal systems, third-party providers, and public databases. This data is then processed and analyzed to provide insights into an organization’s ESG performance. Finally, the suite facilitates the creation of comprehensive ESG reports that can be shared with stakeholders.
Key Features of the IBM Envizi ESG Suite
The following table details some key features, their descriptions, benefits, and illustrative use cases:
| Feature | Description | Benefits | Use Case |
|---|---|---|---|
| Data Aggregation & Integration | Collects ESG data from diverse sources (internal systems, databases, surveys) into a single platform. | Improved data accuracy, reduced manual effort, and a unified view of ESG performance. | A manufacturing company integrates data from its energy consumption meters, waste management systems, and supplier surveys into Envizi to track its carbon footprint and waste reduction initiatives. |
| Data Validation & Assurance | Ensures data quality through automated checks and validation rules. | Enhanced data reliability and confidence in reported ESG metrics. | A financial institution uses Envizi’s validation tools to verify the accuracy of its sustainability-linked loan portfolio data before reporting to regulatory bodies. |
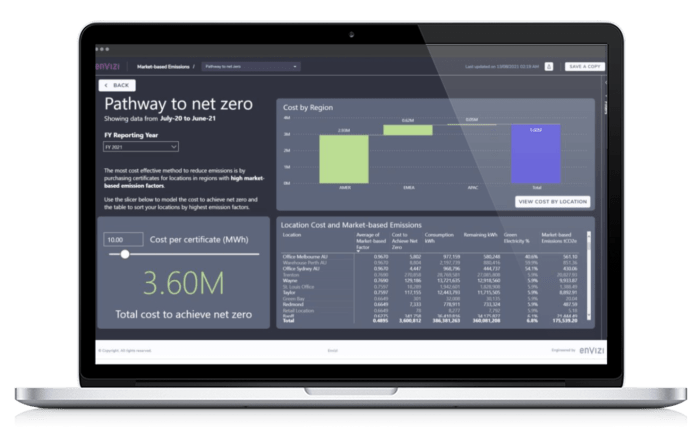
| Scenario Planning & Modeling | Allows users to model the impact of different ESG strategies on their overall performance. | Informed decision-making and proactive risk management. | An energy company uses Envizi to simulate the effects of various renewable energy investments on its carbon emissions and profitability over the next decade. |
| Reporting & Disclosure | Generates customized ESG reports that comply with various frameworks (e.g., GRI, SASB, TCFD). | Streamlined reporting processes and improved communication with stakeholders. | A technology company utilizes Envizi to create a comprehensive ESG report that aligns with the GRI Standards and showcases its sustainability performance to investors and customers. |
Target Audience for IBM Envizi ESG Suite
The IBM Envizi ESG Suite is designed for a broad range of organizations committed to improving their ESG performance and reporting. This includes large corporations, SMEs, and even government agencies. Specifically, the software caters to sustainability professionals, ESG managers, finance teams, and executive leadership who require robust tools to manage and report on their ESG data effectively. Its versatility allows for adaptation across diverse industries, from manufacturing and finance to energy and technology.
Data Management and Integration Capabilities
Source: g2crowd.com
IBM Envizi ESG Suite excels at handling the complexities of ESG data management, offering robust tools for collecting, integrating, validating, and analyzing data from diverse sources. This ensures a comprehensive and reliable view of your organization’s environmental, social, and governance performance.
The suite streamlines the often-challenging process of gathering and consolidating ESG data, empowering businesses to make informed decisions based on accurate and consistent information. This section details the key aspects of Envizi’s data management capabilities.
Data Collection from Diverse Sources
Envizi supports a wide array of data sources, including internal systems (ERP, CRM, supply chain management systems), external databases (industry benchmarks, regulatory filings), and manual data entry. The platform utilizes APIs and automated data extraction techniques to seamlessly integrate data from various formats and sources. For example, it can directly connect to a company’s internal energy consumption database to pull real-time energy usage figures, simultaneously importing carbon emissions data from a third-party sustainability reporting platform. This integrated approach minimizes manual data entry, reducing errors and saving valuable time.
Data Integration Processes and Supported Formats
Data integration within Envizi leverages a variety of methods, including ETL (Extract, Transform, Load) processes and APIs. The suite supports numerous data formats, such as CSV, XLSX, JSON, XML, and databases like SQL Server and Oracle. The system’s flexible architecture allows for customized data mappings and transformations to ensure data compatibility and consistency across different sources. This flexibility allows companies to integrate data regardless of their existing IT infrastructure. For instance, data from a legacy system might require specific transformations to align with the standardized format used within the Envizi platform.
Data Validation and Quality Assurance
Data quality is paramount. Envizi employs several methods to ensure data accuracy and reliability. These include automated data validation rules, outlier detection algorithms, and data quality checks based on pre-defined thresholds. The system flags potential inconsistencies and errors, allowing users to investigate and correct issues before analysis. For example, if energy consumption data shows an unusually high spike, the system will flag it for review, preventing inaccurate reporting. This ensures the data used for analysis and reporting is reliable and trustworthy.
Data Import, Processing, and Analysis Workflow
A typical workflow might involve these steps:
- Data Import: Data is imported from various sources using the methods described above. This could involve direct API connections, file uploads, or manual entry.
- Data Cleaning and Transformation: The imported data undergoes cleaning and transformation processes to standardize formats, handle missing values, and correct inconsistencies. This might involve data normalization, data type conversions, and error correction.
- Data Validation: The cleaned and transformed data is subjected to validation rules and quality checks to identify and address any remaining issues.
- Data Aggregation and Calculation: The validated data is aggregated and used to calculate key ESG metrics, such as carbon footprint, water usage, or diversity metrics.
- Data Analysis and Reporting: The calculated metrics are analyzed using the suite’s reporting and visualization tools to generate insightful reports and dashboards. These reports can be used for internal decision-making, stakeholder communication, and regulatory compliance.
ESG Reporting and Disclosure
Source: pragmaedge.com
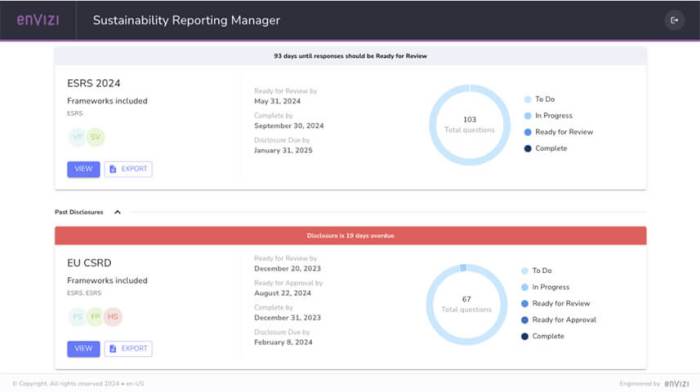
IBM Envizi ESG Suite streamlines the creation of comprehensive and compliant ESG reports, saving you time and ensuring accuracy. It allows you to consolidate data from various sources, perform calculations, and visualize your performance against key sustainability metrics. This section details the suite’s reporting capabilities.
The Envizi suite empowers organizations to generate a wide range of ESG reports, tailored to specific needs and reporting frameworks. This flexibility ensures your reports are both informative and compliant with relevant regulations.
Supported Reporting Frameworks
The IBM Envizi ESG Suite supports a variety of widely recognized ESG reporting frameworks. This allows for seamless reporting across different standards, reducing the complexity of preparing multiple reports. Key frameworks include the Global Reporting Initiative (GRI) Standards, the Sustainability Accounting Standards Board (SASB) Standards, and the Task Force on Climate-related Financial Disclosures (TCFD) recommendations. The suite’s adaptability ensures that your reports align with the specific requirements of your stakeholders and regulatory bodies. For example, you could use the suite to create a GRI-compliant report focusing on material aspects relevant to your business, while simultaneously generating a TCFD report addressing climate-related risks and opportunities.
Customizable Report Templates
Envizi offers a library of pre-built report templates, providing a strong foundation for your ESG reporting. These templates are customizable, allowing you to adapt them to your specific branding and data requirements. For instance, you might choose a template designed for a GRI report, then modify it to include your company logo, specific metrics relevant to your industry, and a customized executive summary. The suite also allows for the creation of completely custom templates from scratch, giving you complete control over the report’s layout and content. Consider a template for a concise sustainability overview, including key performance indicators (KPIs) presented visually through charts and graphs, or a more detailed report analyzing specific environmental impacts such as carbon emissions or water usage.
Generating a Sustainability Report: A Step-by-Step Guide
Creating a sustainability report in IBM Envizi ESG Suite is a straightforward process. The following steps Artikel a typical workflow:
- Data Consolidation and Preparation: Import your ESG data from various sources (e.g., ERP systems, databases, spreadsheets). The suite supports various data formats, simplifying the import process. Ensure data quality by cleaning and validating your information before proceeding.
- Framework Selection: Choose the appropriate reporting framework(s) (GRI, SASB, TCFD, etc.) for your report. The system will then guide you through the required disclosures and metrics.
- Template Selection or Creation: Select a pre-built template or create a custom template to match your organization’s branding and reporting requirements. This includes defining the report’s structure, layout, and visualizations.
- Data Mapping and Calculation: Map your imported data to the selected framework’s requirements. The suite facilitates the calculation of key metrics, automatically generating indicators and visualizations based on your data.
- Report Generation and Review: Generate the report, reviewing and adjusting the content as needed. This might involve adding commentary, refining visualizations, or ensuring data accuracy.
- Distribution and Publication: Once satisfied with the report, distribute it to stakeholders through various channels (e.g., online portal, PDF download). The suite may also offer features to help with publishing the report.
Performance Measurement and Tracking
Source: pragmaedge.com
IBM Envizi ESG Suite provides robust tools for measuring and tracking your organization’s ESG performance. It moves beyond simple data collection to offer insightful analysis and reporting, enabling you to monitor progress toward your sustainability goals and demonstrate accountability to stakeholders. The suite’s capabilities allow for a comprehensive view of your ESG performance, facilitating informed decision-making and strategic planning.
The suite facilitates the measurement of ESG performance metrics through a combination of automated data collection, powerful analytics, and customizable dashboards. It integrates with various data sources, allowing you to consolidate information from disparate systems and create a unified view of your ESG performance. This integrated approach ensures data accuracy and consistency, which is crucial for reliable reporting and effective tracking of progress. The system also allows for the setting of baselines and targets, providing a clear benchmark against which to measure performance.
ESG KPI Monitoring
The IBM Envizi ESG Suite allows monitoring of a wide range of key performance indicators (KPIs) across environmental, social, and governance dimensions. These KPIs can be customized to reflect the specific priorities and needs of your organization. Examples of commonly tracked KPIs include greenhouse gas emissions (Scope 1, 2, and 3), energy consumption, water usage, waste generation, employee satisfaction, diversity and inclusion metrics, board diversity, and corruption incidents. The suite allows for the visualization of these KPIs through interactive dashboards and reports, providing a clear picture of your organization’s ESG performance over time.
Progress Tracking Methods
The suite employs several methods for tracking progress toward sustainability goals. These include setting specific targets for KPIs, establishing baselines to measure improvement, and using trend analysis to identify areas for improvement. The system provides tools for visualizing progress over time, highlighting areas where performance is exceeding or falling short of targets. Regular reporting and analysis capabilities ensure that progress is monitored closely, enabling timely interventions and adjustments to strategies as needed. For instance, if your carbon emissions are consistently exceeding targets, the suite can help pinpoint the sources of those emissions, allowing for targeted mitigation efforts.
Comparative Analysis of Performance Measurement Approaches
The IBM Envizi ESG Suite supports various performance measurement approaches, allowing for a flexible and adaptable strategy tailored to your specific needs. For example, you might use a materiality assessment to identify the most significant ESG issues for your organization, focusing your efforts and resources on those areas. Alongside this, you could utilize frameworks like the Global Reporting Initiative (GRI) Standards or the Sustainability Accounting Standards Board (SASB) Standards to ensure your reporting aligns with widely accepted best practices. The suite allows for comparison of your performance against industry benchmarks and competitors, providing valuable insights and informing strategic decision-making. This comparative analysis helps identify areas where your organization excels and areas where improvements are needed, driving continuous improvement in your ESG performance. The platform also allows for scenario planning, enabling you to model the impact of different strategies on your future ESG performance.
Benchmarking and Competitor Analysis

Source: co.jp
IBM Envizi ESG Suite empowers you to not just track your own ESG performance, but also to understand how you stack up against your competitors. This competitive intelligence is crucial for identifying opportunities for improvement, setting ambitious targets, and demonstrating leadership within your industry. Benchmarking allows you to see where you excel and where you need to focus your efforts, ultimately driving better ESG outcomes.
The suite facilitates benchmarking by providing access to a comprehensive database of industry-specific ESG data. This allows for a robust comparative analysis of your performance against your peers, highlighting areas of strength and weakness relative to the broader market. The platform’s analytical tools allow you to delve deep into this data, uncovering valuable insights to inform your strategy.
Industry Benchmarking Capabilities
The Envizi suite offers several features to enable effective industry benchmarking. It allows you to select specific peer groups based on various criteria like industry sector, geographic location, company size, and revenue. You can then compare your performance across a range of ESG metrics, visualizing the results in customizable dashboards and reports. The platform automatically identifies statistically significant differences in performance between your organization and its peers, providing a clear picture of your relative standing. This allows for a targeted approach to improvement, focusing resources on the areas where you lag behind the competition.
Comparative Analysis of ESG Performance
The suite supports comparative analysis through the creation of custom reports and dashboards. These can be tailored to focus on specific ESG metrics, allowing for a granular understanding of your relative performance. You can easily visualize your progress over time and compare your trajectory to that of your competitors. The platform also provides the capability to filter and segment data based on various factors, such as reporting periods or specific environmental or social initiatives, enabling a deeper level of analysis. For instance, you might compare your carbon emissions intensity against your peers within the same industry, revealing areas where you could improve efficiency.
Identifying Best Practices and Areas for Improvement
By analyzing the ESG performance of high-performing companies within your industry benchmark, you can identify best practices and areas where you can improve. The suite’s analytical capabilities allow you to pinpoint specific initiatives or strategies employed by leading companies that have contributed to their strong ESG performance. This information can be used to inform your own ESG strategy, helping you to develop more effective programs and achieve better results. For example, if you see that a competitor is significantly outperforming you in waste reduction, you can investigate their methods and adapt them to your operations.
Comparative ESG Performance Visualization
Let’s imagine a comparison of three hypothetical companies – GreenTech, EcoSolutions, and SustainCo – within the renewable energy sector. The following data, generated within the Envizi suite, represents their performance across three key ESG metrics: Carbon Emissions (tons of CO2e), Renewable Energy Usage (percentage), and Waste Diversion Rate (percentage).
+—————–+—————–+—————–+—————–+
| Company | Carbon Emissions | Renewable Energy | Waste Diversion |
+—————–+—————–+—————–+—————–+
| GreenTech | 1000 | 85% | 70% |
+—————–+—————–+—————–+—————–+
| EcoSolutions | 1500 | 70% | 60% |
+—————–+—————–+—————–+—————–+
| SustainCo | 800 | 90% | 75% |
+—————–+—————–+—————–+—————–+
This simplified table illustrates how the Envizi suite might visually represent the comparative ESG performance. A more sophisticated visualization within the suite could include interactive charts and graphs, allowing for deeper exploration of the data. For example, a bar chart could compare carbon emissions across the three companies, while a line graph could show the trend of renewable energy usage over time for each company. Such visualizations would immediately highlight SustainCo’s superior performance across all three metrics, indicating potential best practices to learn from. Conversely, EcoSolutions’ relatively lower performance suggests areas requiring focused attention and improvement strategies.
Integration with Other IBM Solutions
Source: next-decision.fr
IBM Envizi ESG Suite isn’t a standalone solution; it’s designed to work seamlessly with other IBM offerings, creating a powerful ecosystem for comprehensive ESG management. This integration enhances data flow, reduces manual effort, and provides a more holistic view of your sustainability performance. The interconnectedness allows for a more efficient and accurate ESG strategy.
The benefits of integrating Envizi with other IBM products extend beyond simple data exchange. It fosters a unified approach to ESG, eliminating data silos and inconsistencies. This unified data view allows for more informed decision-making, improved reporting accuracy, and better overall ESG performance tracking. Imagine the efficiency gains from having your environmental data automatically populate your sustainability reports – that’s the power of integration.
IBM Envizi and IBM Cloud Pak for Data Integration
IBM Envizi’s integration with IBM Cloud Pak for Data provides a robust platform for managing and analyzing ESG data. This integration allows users to leverage Cloud Pak for Data’s powerful data governance, integration, and analytics capabilities to enhance the effectiveness of Envizi. Data from various sources can be consolidated, cleaned, and transformed within Cloud Pak for Data before being fed into Envizi for analysis and reporting, ensuring data quality and consistency throughout the entire ESG management process. This streamlined workflow eliminates manual data entry and reduces the risk of errors. For example, a company could integrate data from its supply chain management system (potentially using IBM Sterling Supply Chain Manager) into Cloud Pak for Data, which then cleans and standardizes the data before sending it to Envizi for ESG analysis and reporting.
IBM Envizi and Watson AI Integration
Integrating Envizi with IBM Watson AI unlocks advanced analytical capabilities for ESG data. Watson’s AI can identify trends, patterns, and anomalies within the ESG data that might be missed by human analysts. This can lead to more accurate predictions of future ESG performance and facilitate proactive risk management. For instance, Watson could analyze historical emissions data to predict future emissions based on various factors, enabling the company to proactively implement mitigation strategies. This predictive analysis allows for more informed decision-making and more effective resource allocation.
Diagram of IBM Envizi Suite Interconnections
Imagine a central hub representing the IBM Envizi ESG Suite. Several spokes radiate outward, each connecting to a different IBM technology. One spoke connects to IBM Cloud Pak for Data, representing the data integration and management capabilities. Another spoke connects to IBM Watson, illustrating the AI-powered analytics. A third spoke could represent IBM Maximo, showcasing integration with asset management data for tracking energy consumption and emissions related to physical assets. A final spoke might connect to IBM Planning Analytics, highlighting the ability to integrate ESG data into financial planning and forecasting models. These spokes symbolize the seamless flow of data between Envizi and other IBM solutions, creating a comprehensive and interconnected ESG management system. The data flows are bidirectional, with Envizi both receiving and sending data to enhance its functionality and provide a holistic view of ESG performance.
User Experience and Interface: IBM Envizi Esg Suite
Source: credly.com
IBM Envizi ESG Suite boasts a user interface designed for intuitive navigation and efficient data management. The platform aims to streamline the ESG reporting process, making complex data accessible and understandable for users with varying levels of technical expertise. Its success hinges on a user-friendly design that minimizes the learning curve and maximizes productivity.
The suite’s design prioritizes a clean, modern aesthetic. Information is presented in a clear and organized manner, avoiding cluttered dashboards or overwhelming displays. The navigation is straightforward, with clearly labeled menus and intuitive search functionalities. Users can easily switch between different modules, accessing the data and tools they need without unnecessary clicks or searches.
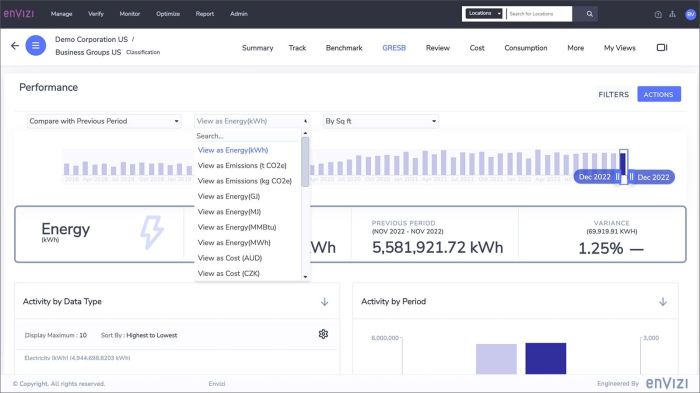
Interface Navigation and Structure
The main dashboard provides a quick overview of key performance indicators (KPIs) and allows for easy access to various reporting and analysis tools. Navigation is primarily menu-driven, with clear visual cues and tooltips to guide users. The hierarchical structure of menus ensures that users can quickly locate the specific information they require. For instance, navigating to carbon footprint data is a simple process involving a few clicks within the defined menus. A robust search functionality further simplifies the process of locating specific data points or reports.
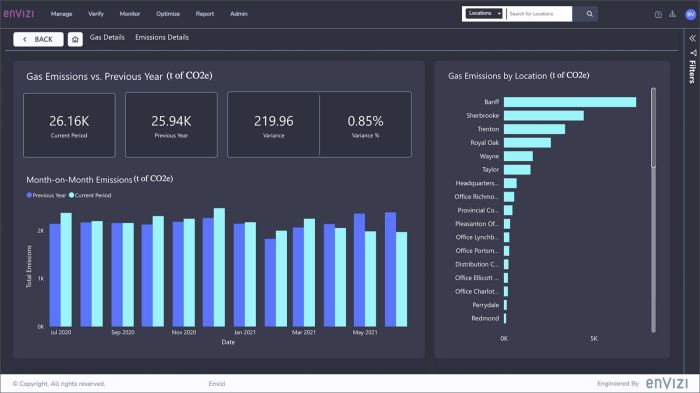
Reporting and Visualization Tools
Envizi offers a wide array of reporting and visualization tools, enabling users to create customized reports and dashboards. These tools allow for the creation of various chart types, including bar charts, line graphs, pie charts, and maps, to visually represent ESG data. Users can also download reports in various formats (PDF, CSV, Excel) for easy sharing and distribution. Interactive dashboards allow users to drill down into specific data points, exploring trends and patterns within their ESG data. For example, a user can create a report visualizing their carbon emissions over time, broken down by source, and then easily export this data for inclusion in a sustainability report.
Hypothetical User Scenarios and Feedback
Consider a sustainability manager at a large corporation. They need to quickly generate a report on their company’s carbon footprint for their annual sustainability report. Using Envizi, this manager can easily access the necessary data, create a customized report with relevant visualizations, and export it in the required format within a short timeframe. The intuitive interface minimizes the time spent on data manipulation and report generation, allowing the manager to focus on analysis and strategic decision-making.
Another scenario involves a junior analyst tasked with benchmarking their company’s performance against competitors. The Envizi platform allows this analyst to easily access competitor data (provided it’s available and permissioned), generate comparative reports, and identify areas for improvement. The visualization tools aid in quickly understanding the key differences in ESG performance between companies. The user-friendly interface minimizes the need for extensive training, allowing the analyst to quickly become proficient in using the platform.
Potential Usability Improvements
- Improved integration with other commonly used business intelligence tools.
- Enhanced customization options for dashboards and reports, allowing users to tailor the interface to their specific needs.
- Development of more interactive tutorials and training materials to support user onboarding.
- Implementation of a more robust help and support system, including detailed documentation and readily available customer service.
- Expansion of the range of supported data formats and integrations with various enterprise resource planning (ERP) systems.
Conclusion
Source: rational. consulting
Ultimately, IBM Envizi ESG Suite empowers organizations to take control of their ESG journey. By streamlining data management, enhancing reporting capabilities, and providing valuable insights into performance, the suite facilitates a more sustainable and responsible business future. The ability to benchmark against peers, track progress toward ambitious goals, and communicate transparently about ESG performance provides a significant competitive advantage in today’s increasingly ESG-conscious world. This comprehensive platform offers a clear path to achieving sustainability objectives and building a more responsible and resilient business.