IBM Envizi Sustainability Software Deep Dive
IBM Envizi is a powerful sustainability management platform that helps organizations track, analyze, and report on their environmental impact. It streamlines data management, offering insightful visualizations and reporting tools to support progress toward sustainability goals. This deep dive explores its core functionalities, data handling capabilities, reporting features, and integrations, showing you how Envizi can help your organization achieve its environmental objectives.
From data ingestion and validation to creating impactful reports and dashboards, we’ll cover the key aspects of using IBM Envizi effectively. We’ll also explore its integration capabilities and how it helps in tracking key performance indicators (KPIs) for sustainability initiatives. Get ready to unlock the potential of your environmental data!
IBM Envizi Overview

Source: datatechvibe.com
IBM Envizi is a comprehensive sustainability management platform designed to help organizations track, analyze, and report on their environmental, social, and governance (ESG) performance. It provides a centralized system for managing environmental data, streamlining processes, and improving decision-making related to sustainability initiatives. Think of it as a one-stop shop for all your sustainability data needs.
IBM Envizi’s core functionality centers around data collection, analysis, and reporting. It allows companies to consolidate data from various sources, perform sophisticated calculations, and generate impactful reports to meet internal and external reporting requirements. This includes everything from carbon accounting and emissions management to water usage tracking and waste reduction efforts.
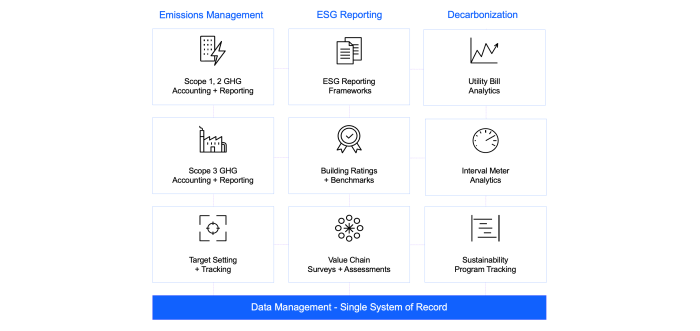
IBM Envizi Modules and Components
The platform is modular, allowing organizations to select the components that best suit their specific needs and scale as their sustainability programs mature. Key modules often include data management, carbon accounting, water management, waste management, energy management, and reporting and analytics. These modules work together to provide a holistic view of an organization’s environmental performance. For example, the carbon accounting module might integrate with the energy management module to provide a complete picture of greenhouse gas emissions from energy consumption. The reporting and analytics module then allows for the creation of customizable reports for stakeholders.
Environmental Data Management with IBM Envizi
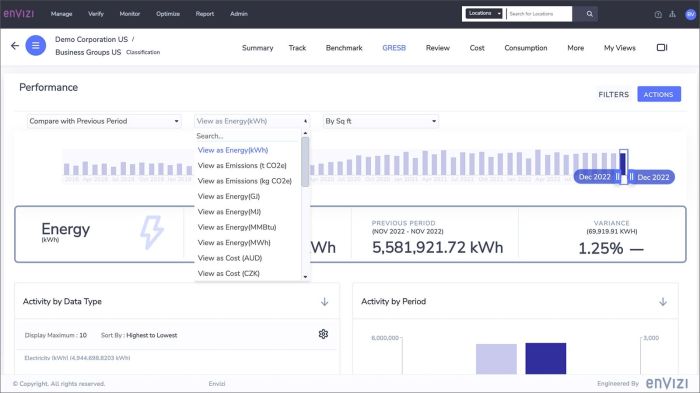
IBM Envizi helps organizations manage their environmental data by providing a centralized repository for all relevant information. This eliminates data silos and ensures data consistency and accuracy. The platform supports various data import methods, including manual entry, automated data feeds, and integration with other enterprise systems. Once data is within Envizi, users can leverage its powerful analytics capabilities to identify trends, pinpoint areas for improvement, and track progress toward sustainability goals. This allows for data-driven decision-making, enabling more effective and efficient sustainability programs.
IBM Envizi Compared to Other Sustainability Software
Several other sustainability software solutions exist, each with its strengths and weaknesses. Direct comparisons are difficult without specifying particular competitors, as features and capabilities vary widely. However, a key differentiator for IBM Envizi is often cited as its robust data management capabilities and integration with other IBM solutions, such as its weather data services which can be used for climate risk modeling. Some competitors might focus more on specific aspects of sustainability, like carbon accounting, while Envizi aims for a broader, more integrated approach. Others might have stronger visualization tools, whereas Envizi’s strength lies in its comprehensive data management and reporting features. The optimal choice depends heavily on an organization’s specific needs and priorities. For instance, a small company focused solely on carbon footprint reduction might find a more specialized solution sufficient, while a large multinational corporation with complex supply chains and diverse sustainability goals might prefer the comprehensive nature of IBM Envizi.
IBM Envizi Data Management
Source: app domain.cloud
Getting your environmental data into IBM Envizi is the first crucial step toward effective sustainability management. This section details how Envizi handles data ingestion, integration, validation, and organization, empowering you to build a robust and reliable environmental data foundation.
Data Ingestion and Integration, IBM envision
IBM Envizi offers a flexible approach to data ingestion, allowing you to import data from various sources and formats. The process typically involves connecting to your data sources, defining data mappings, and scheduling regular data updates. Envizi supports both manual uploads and automated integrations, enabling you to choose the method best suited to your data workflow. Automated integrations, using APIs or ETL tools, are generally preferred for larger datasets and for maintaining data consistency. For example, you might connect directly to your ERP system for energy consumption data or use a dedicated data pipeline to bring in emissions data from various facilities.
Supported Data Formats
Envizi supports a wide array of data formats to accommodate diverse data sources. This includes common file types like CSV, Excel (XLS and XLSX), and JSON, as well as database connections to systems like SQL Server, Oracle, and MySQL. The platform also supports more specialized formats, often used in environmental data reporting, such as XML and specialized reporting files. The ability to handle various formats ensures compatibility with existing systems and reduces the need for extensive data transformation before importing.
Data Validation and Quality Control
Data quality is paramount. Envizi employs several methods to ensure data accuracy and reliability. These include automated checks for data completeness, consistency, and plausibility. For example, Envizi can flag inconsistencies such as negative energy consumption values or emissions figures exceeding expected levels. Manual validation is also supported, allowing users to review and correct identified errors. Custom validation rules can be defined to meet specific business requirements, ensuring the data meets the organization’s quality standards. Data lineage tracking helps identify the origin of data, facilitating debugging and improving data trustworthiness.
Best Practices for Organizing Environmental Data
Organizing your data effectively within Envizi is key to maximizing its value. A well-structured data model facilitates efficient reporting, analysis, and decision-making. This involves creating clear and consistent data categories, using standardized units of measure, and implementing a robust metadata management system. Consider adopting a hierarchical structure to organize data by location, period, and emission type, for example. Consistent naming conventions are also crucial for data discoverability and ease of use.
Data Types and Storage
The following table illustrates different data types and their appropriate storage within the IBM Envizi platform. Note that the optimal storage method may depend on the specific data volume and usage patterns.
| Data Type | Description | Example | Recommended Storage |
|---|---|---|---|
| Energy Consumption | kWh, MWh, etc. | Electricity usage per building | Timeseries Database |
| Greenhouse Gas Emissions | CO2e, tCO2e, etc. | Scope 1, 2, and 3 emissions | Timeseries Database |
| Waste Generation | kg, tons, etc. | Waste produced by the manufacturing process | Relational Database |
| Water Consumption | m³, liters, etc. | Water usage in industrial processes | Timeseries Database |
IBM Envizi Reporting and Visualization
Source: abs-consulting.com
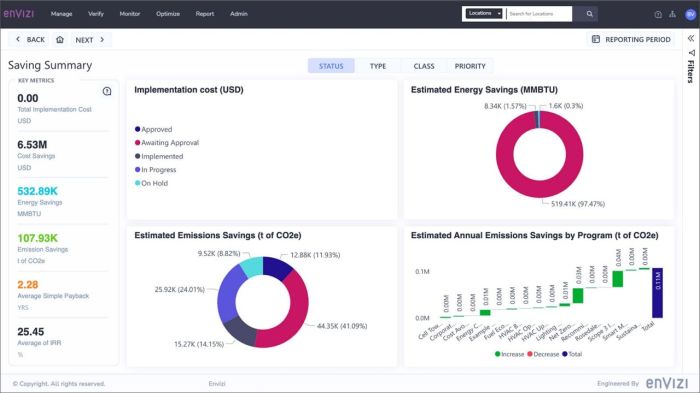
IBM Envizi offers robust reporting and visualization tools to effectively communicate your environmental, social, and governance (ESG) data. By leveraging its powerful data management capabilities, you can create insightful reports and dashboards that showcase key performance indicators (KPIs) and trends, enabling data-driven decision-making for sustainability initiatives. This section will explore the various reporting and visualization options available within the platform.
Creating Various Report Types
Envizi allows you to generate a wide range of reports, tailored to your specific needs. You can create standard reports, such as summary reports providing an overview of key metrics, or delve into more detailed analyses with custom reports focusing on specific aspects of your ESG performance. For example, you might generate a report summarizing your carbon footprint across different facilities or a report detailing the progress of your renewable energy initiatives. The platform supports various report formats, including PDFs and interactive online dashboards, allowing for flexibility in dissemination and accessibility.
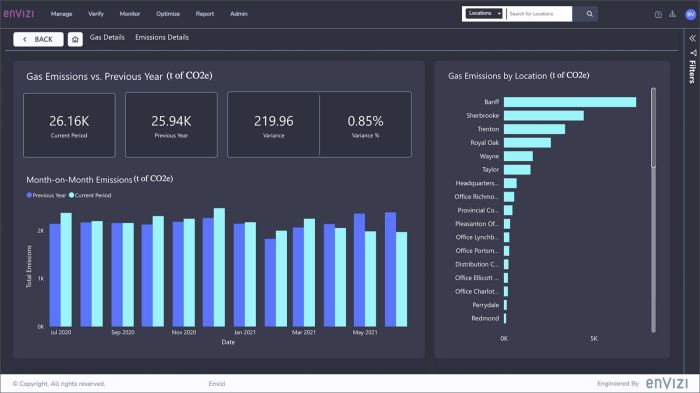
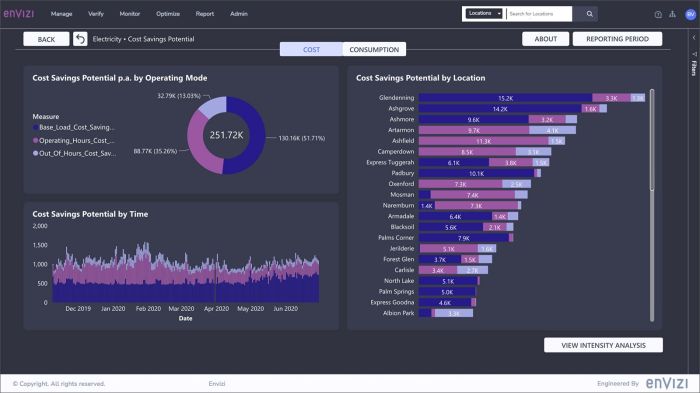
Visualization Capabilities
Envizi provides a rich set of visualization tools to present your data clearly and compellingly. A variety of chart types are available, including bar charts, line charts, pie charts, scatter plots, and maps, allowing you to choose the most effective visual representation for your data. These charts can be easily integrated into interactive dashboards, providing a dynamic overview of your ESG performance. Dashboards can be customized to display key metrics and trends, offering a comprehensive view of your sustainability progress. For instance, a dashboard might show your energy consumption over time, alongside your carbon emissions reduction targets.
Sample Report: Key Environmental Metrics
This sample report showcases key environmental metrics using a hypothetical dataset. The data illustrates energy consumption and carbon emissions for three different facilities over two years. Imagine a company with facilities A, B, and C tracking their sustainability performance.
| Facility | Year | Energy Consumption (kWh) | CO2 Emissions (tonnes) |
|---|---|---|---|
| A | 2022 | 100000 | 50 |
| A | 2023 | 90000 | 45 |
| B | 2022 | 150000 | 75 |
| B | 2023 | 140000 | 70 |
| C | 2022 | 50000 | 25 |
| C | 2023 | 45000 | 22.5 |
This table can be easily visualized within Envizi using various chart types to highlight trends and comparisons. For example, a bar chart could compare energy consumption across facilities, while a line chart could show the change in CO2 emissions over time for each facility.
Customization Options
Envizi offers extensive customization options for reports and dashboards. You can personalize the layout, choose from a variety of pre-defined templates, or create custom templates from scratch. Furthermore, you can add branding elements, such as logos and company colors, to align reports with your corporate identity. Data filtering and sorting capabilities allow you to focus on specific aspects of your data, creating targeted reports and dashboards. These customization features ensure that your reports are not only informative but also visually appealing and aligned with your organizational branding.
IBM Envizi and Sustainability Goals
Source: abs-consulting.com
IBM Envizi is a powerful platform designed to help organizations track and manage their environmental, social, and governance (ESG) performance. It provides a centralized system for collecting, analyzing, and reporting on sustainability data, enabling businesses to effectively measure progress toward their sustainability goals and make data-driven decisions to improve their environmental impact. This allows for a more transparent and accountable approach to sustainability initiatives.
Organizations use IBM Envizi to streamline their sustainability efforts, moving beyond simple data collection to proactive management and reporting. By connecting disparate data sources and providing advanced analytics, Envizi helps companies gain a holistic view of their sustainability performance, identify areas for improvement, and demonstrate their commitment to environmental responsibility to stakeholders.
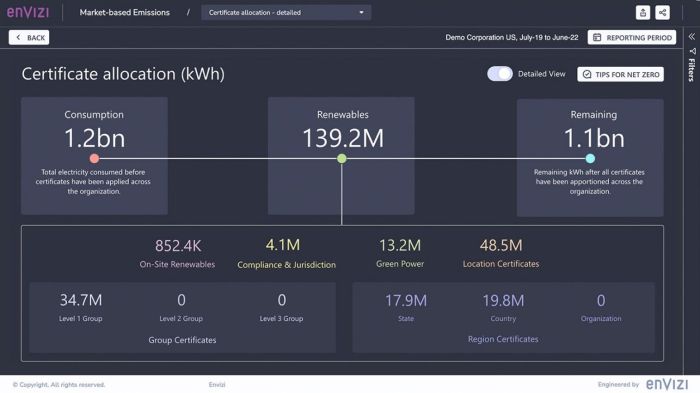
Key Performance Indicators (KPIs) Monitored with IBM Envizi
IBM Envizi allows organizations to monitor a wide range of KPIs relevant to their sustainability goals. The specific KPIs tracked will vary depending on the organization’s industry, size, and specific targets. However, common examples include greenhouse gas (GHG) emissions (Scope 1, 2, and 3), energy consumption, water usage, waste generation, and biodiversity impact. The platform’s flexibility allows for the customization of KPIs to meet the specific needs of each organization, ensuring that the most relevant metrics are tracked and analyzed. This tailored approach is crucial for achieving meaningful results and demonstrating progress effectively.
Examples of Improving Environmental Performance with IBM Envizi
Organizations can leverage IBM Envizi in several ways to enhance their environmental performance. For instance, a manufacturing company could use Envizi to track energy consumption across its facilities, identify energy-intensive processes, and implement energy-efficiency measures. This data-driven approach allows for targeted interventions, maximizing the impact of sustainability initiatives. Similarly, a retail company might use Envizi to monitor its supply chain emissions, identify high-impact suppliers, and collaborate with them to reduce their environmental footprint. The platform facilitates this collaboration by providing a transparent and accessible platform for sharing data and tracking progress collectively. This collaborative approach is key to achieving a roader sustainability impact across the entire value chain.
Case Study: Successful Implementation of IBM Envizi
This case study illustrates how a hypothetical large food processing company, “GreenFoods,” successfully used IBM Envizi to meet its ambitious sustainability targets.
- Challenge: GreenFoods aimed to reduce its carbon emissions by 30% within five years and lacked a centralized system for tracking emissions across its complex global supply chain.
- Solution: GreenFoods implemented IBM Envizi to collect and analyze emissions data from various sources, including its facilities, transportation networks, and agricultural suppliers. The platform enabled the aggregation of data from diverse formats and sources, providing a unified view of the company’s overall emissions profile.
- Implementation: The implementation involved integrating Envizi with existing enterprise resource planning (ERP) systems and data from third-party suppliers. GreenFoods trained employees on using the platform and established clear reporting protocols.
- Results: By leveraging Envizi’s analytics capabilities, GreenFoods identified significant emission hotspots within its supply chain and implemented targeted reduction strategies. Within three years, the company exceeded its initial target, achieving a 35% reduction in carbon emissions. This success was largely attributed to the data-driven insights provided by Envizi, enabling informed decision-making and effective collaboration across the organization and its supply chain.
IBM Envizi Integrations and APIs

Source: rational. consulting
IBM Envizi’s power extends beyond its core functionality through robust integration capabilities and a comprehensive set of APIs. These tools allow seamless data exchange with other enterprise systems, automating workflows and unlocking deeper insights from your sustainability data. This section details how you can leverage these integrations and APIs to optimize your environmental, social, and governance (ESG) performance management.
Envizi offers a variety of ways to connect with other software, enhancing its capabilities and streamlining your data processes. These integrations enable a centralized view of your sustainability data, regardless of its origin. The APIs, in particular, provide a powerful mechanism for automating data transfer and generating customized reports.
Integration Capabilities
Envizi integrates with various enterprise resource planning (ERP) systems, customer relationship management (CRM) systems, and specialized sustainability software. This allows for the consolidation of sustainability data from disparate sources into a single, unified platform. The specific integrations available depend on the version of Envizi and may require custom development in some cases. Common integration points include data import/export functionalities and real-time data feeds. Successful integrations typically involve mapping data fields between Envizi and the external system to ensure data accuracy and consistency.
Available APIs
IBM Envizi provides RESTful APIs, enabling programmatic interaction with its core functionalities. These APIs allow developers to build custom integrations and automate tasks such as data upload, report generation, and data analysis. Detailed API documentation, including specifications and examples, is typically available through the Envizi support portal or developer resources. Authentication mechanisms usually involve API keys or OAuth 2.0 for secure access. Rate limits are often in place to manage API usage and ensure service stability.
Automating Data Transfer and Reporting
The Envizi APIs allow for the automation of several key processes. For example, you can automatically upload data from your ERP system on a scheduled basis, eliminating manual data entry and reducing errors. Similarly, you can automate the generation of regular sustainability reports, ensuring the timely delivery of crucial information to stakeholders. Using scripting languages like Python or other tools, you can create custom workflows that interact with the Envizi API to manage your data and generate reports based on specific criteria. Error handling and logging are essential components of any automated process to ensure data integrity and identify potential issues.
Examples of Custom Integrations
Several custom integrations are possible using the Envizi APIs. These integrations demonstrate the flexibility and power of Envizi’s API-driven architecture.
- Integration with a Manufacturing Execution System (MES): This integration allows for the real-time capture of energy consumption data directly from the factory floor, providing immediate feedback on energy efficiency initiatives.
- Integration with a Supply Chain Management (SCM) system: This enables tracking of emissions across the entire supply chain, improving transparency and accountability for sustainability performance.
- Automated Report Generation for Regulatory Compliance: The API can be used to automatically generate reports required for various environmental regulations, ensuring timely and accurate compliance.
- Custom Dashboard Creation: Developers can create tailored dashboards that visualize specific sustainability metrics, providing stakeholders with the most relevant information.
IBM Envizi Security and Access Control
Source: rational. consulting
Protecting your environmental data is paramount, and IBM Envizi employs a robust security framework to ensure its confidentiality, integrity, and availability. This section details the security features, access management, and data privacy measures implemented within the platform.
IBM Envizi’s security is built on a multi-layered approach, combining infrastructure security, data encryption, and granular access controls to safeguard your environmental data. This ensures that only authorized personnel can access and modify sensitive information, minimizing the risk of unauthorized access or data breaches.
User Access Management
Managing user access within IBM Envizi involves assigning specific roles and permissions to individual users or groups. This granular control ensures that each user only has access to the data and functionalities necessary for their role. Administrators can define roles with tailored permissions, granting access to specific datasets, modules, or actions. For instance, a data analyst might have read-only access to a specific dataset, while a project manager might have full read-and-write access to a different set, and an administrator would have full access to the entire system. This role-based access control (RBAC) model ensures a secure and efficient workflow.
Data Encryption and Protection
Data encryption is a cornerstone of IBM Envizi’s security strategy. Data at rest and in transit is encrypted using industry-standard encryption algorithms, protecting it from unauthorized access even if a breach occurs. This encryption is applied to both the data itself and the communication channels used to access it. The specific encryption algorithms and key management practices are aligned with industry best practices and relevant compliance standards, such as ISO 27001 and SOC 2.
Data Privacy and Compliance
IBM Envizi is designed to help organizations comply with various data privacy regulations, including GDPR, CCPA, and others. The platform offers features to support data subject requests, data retention policies, and audit trails. These capabilities allow organizations to demonstrate compliance with relevant regulations and maintain the privacy of their environmental data. For example, data masking techniques can be used to anonymize sensitive information when necessary, while access logs provide a comprehensive audit trail of all user activities.
User Roles and Access Levels
The following table illustrates a simplified example of user roles and their corresponding access levels within IBM Envizi. Note that the specific roles and permissions can be customized based on an organization’s needs.
| Role | Data Access | Functionality Access |
|---|---|---|
| Administrator | Full access to all data | Full access to all platform functionalities, including user management and system configuration. |
| Data Analyst | Read-only access to designated datasets | Access to reporting and visualization tools, but no permission to modify data or system settings. |
| Project Manager | Read and write access to project-specific data | Access to data entry, reporting, and collaboration tools related to their projects. |
| Data Entry Clerk | Limited write access to specific data fields | Access to data entry forms, but limited or no access to reporting or system administration tools. |
Final Conclusion
Source: abs-consulting.com
IBM Envizi provides a comprehensive solution for organizations striving for environmental responsibility. By efficiently managing environmental data, generating insightful reports, and integrating with other systems, Envizi empowers businesses to make data-driven decisions and accelerate their journey toward sustainability. Its user-friendly interface and robust features make it a valuable asset for achieving environmental goals and showcasing sustainability performance.